

I imagine that this blog—on the admittedly dry topic of the U.S. Net International Investment Position (NIIP)—may not top my list of popular posts this month.
Let’s start with the basics: what is the NIIP? The U.S. net international investment position is the difference between the total value of foreign assets owned by U.S. residents and the total value of U.S. assets owned by foreign residents. In simple terms, it measures whether the U.S. is a net creditor (positive NIIP) or a net debtor (negative NIIP) to the rest of the world.
I chose this topic because I believe that the prevailing consensus—that large budget and current account deficits don’t matter much—is fundamentally flawed. What often goes unacknowledged is the extent to which this spending excess has led to a major transfer of ownership claims to foreigners, a trend that seems likely to accelerate over time.
When domestic consumption and investment exceed production, the gap must be filled through imports. Financing a trade deficit requires borrowing from foreign entities (via Treasury bonds and other IOUs) or selling domestic assets like stocks and real estate.
As my title, 'Do Deficits Matter,' suggests, I adhere to the traditional view that large budget deficits are causally linked to trade deficits—known as the 'Twin Deficits' issue. High budget deficits make it likely that total consumption, investment, and government spending surpass domestic production, necessitating imports. There is, however, an alternative view, championed by Ben Bernanke, which posits that strong global demand for U.S. financial assets causes trade imbalances—a perspective known as the 'savings glut hypothesis.' I find explanations focusing on the current account align better with historical data. For instance, a closer look at the time series shows that the current account began experiencing issues when significant budget deficits emerged under the Reagan administration in the early to mid-1980s.
If our net international investment position becomes sufficiently negative, reversing the current account deficit can become difficult or even impossible, as a large portion of our resources would be required just to pay the returns on U.S. assets held by foreign investors. This aspect of international trade is not widely understood. Once a nation becomes a debtor, its current account deficit generally equals the trade deficit (in goods and services) plus the net returns owed to foreign investors who own its assets. When the debt becomes deep enough, recovery is nearly impossible because the trade balance would need to grow significantly just to bring the current account to zero.
Since World War II, the U.S. current account has gone through three distinct phases. In the first phase, from 1945 to 1965, we consistently exported more goods and services than we imported, increasing our ownership of overseas assets. Our trading partners, in turn, paid for their trade deficits by ceding ownership interests in their assets to us. The second phase, from 1965 to 1988, was a transition period during which the United States ran current account deficits but still maintained a net positive balance in international assets. The third phase, from 1986 to the present, has seen a negative net international investment position, accompanied by ongoing large current account deficits.
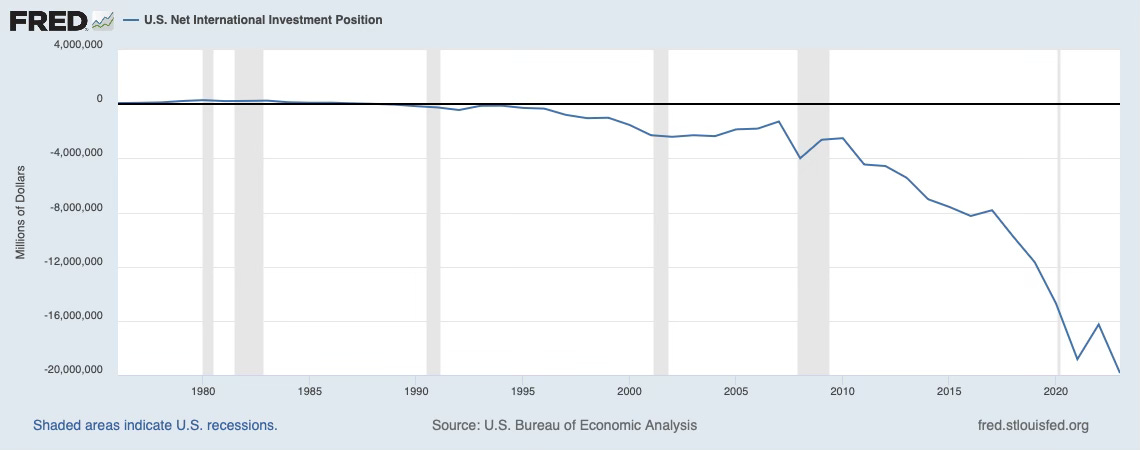
If American investments abroad performed as well as foreign investments in the U.S., the Net International Investment Position (NIIP) could be roughly approximated by summing all past current account balances, ignoring exchange rate and valuation effects.
For many years, Americans benefited from what Charles De Gaulle referred to as 'exorbitant privilege,' a term often attributed to economist Jacques Rueff. The dollar's role as the international reserve currency created a consistent foreign demand for dollars and dollar-denominated assets. This demand meant that U.S. investments abroad tended to outperform foreign investments in the U.S., resulting in a stronger NIIP than historical current account balances alone would suggest.
This trend reached a peak in the late 2000s and early 2010s, despite the U.S. running substantial current account deficits. From 2005 to 2015, the average annual trade deficit with China alone was nearly $540 billion. As payment, China predominantly received low-yielding U.S. government debt and government-backed agency debt.
The sustained superior performance of U.S. investments abroad led many to believe that this pattern would continue indefinitely. However, a recent paper titled The End of Privilege: A Reexamination of the Net Foreign Asset Position of the United States (July 12, 2023) by Andrew Atkeson, Jonathan Heathcote, and Fabrizio Perri documents significant changes in U.S. NIIP dynamics.
The rest of this piece will primarily summarize this important work, referred to hereafter as Perri et al.
Let’s start with an excerpt from the paper (NFA, Net Foreign Assets, and NIIP are the same thing): “Note that by 2020, the U.S. NFA position was more negative than cumulated current accounts over the entire 1990 to 2020 period. As is evident in the figure, a large portion of the decline of the U.S. NFA position in this third phase was driven by negative valuation effects, meaning that during this period, U.S. residents experienced consistently lower capital gains on their foreign asset holdings than those enjoyed by ROW residents on their U.S. assets.”
Very few economists would have guessed that this was true. It comes as a shock because the conventional wisdom that US investments abroad do better than foreign investments in the US is well ingrained. The drivers of the surprising deterioration of the NIIP, from the US perspective, are threefold:
Both of the raw numbers have been getting big (our ownership of foreign assets, and their ownership of ours), and they recently moved the wrong way from our perspective. In recent years, our holdings of foreign assets didn't do well, and foreigners’ holdings of our assets did exceptionally well.
The value of foreign assets and foreign liabilities, which one might think would co-move, have in fact not co-moved closely in the past decade.
For a long time, we didn't give up equity, only debt. But then we started to give up equity ownership as well.
At this point, it’s best for me to take a backseat to the authors. Excerpts from the paper are in bold below. My commentary is not in bold.
Perri et al:
“We now turn to changes in asset valuations. Figure 4a decomposes the cumulated valuation effects plotted in Figure 2 into valuation effects arising from equity and non-equity positions. The figure shows that net valuation changes arise almost exclusively from the equity positions. Although in principle both categories are subject to relative valuation changes (due both to price changes and to exchange rate movements for assets denominated in different currencies), these effects are quantitatively much more important for the equity positions.
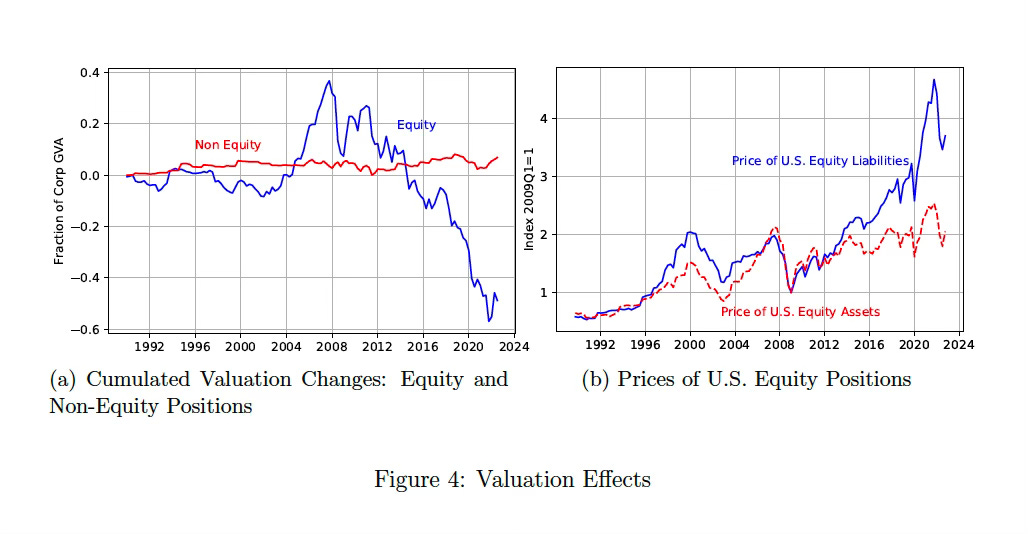
Why are equity valuation effects so large? Figure 4b plots the price indexes, both in dollar terms, that the BEA uses to revalue U.S. equity assets and liabilities. We have normalized the price indexes so that both are equal to one in the first quarter of 2009. Recall that the equity valuation effects in Figure 4a are computed by multiplying the gross equity asset and liability positions plotted in Figure 3 by the growth in these price indexes.
In the 1990s, the price of U.S. equity liabilities rose more rapidly than the price of U.S. foreign equity assets. But cumulated valuation effects were small, because gross international equity positions were relatively small in the early part of our sample (Figure 3), so international differentials in equity price dynamics did not translate into large effects on the value of the NFA position.
A big part of the Perri et al story is that the equity portion of Net Foreign Assets has grown in importance over time. Perri et al notes that the impressive US stock market of the late 1990s had little effect on the US Net Asset Position. Keep in mind the stylized facts of the US NIIP: it was very positive from 1945-1965; then it remained positive until 1989 despite very large current account deficits (we were slowly moving from a creditor country to a debtor country); since then we’ve run very large current deficits and we’ve had a nearly straight-line degradation of the US NIIP. In the late 1990s, both components of the NIIP (our ownership of assets abroad, and foreigners ownership of US assets) were small, so valuation shifts in either component did not matter much. By the late 2010s and early 2020s, both components were very large—especially foreign ownership of US assets—and so valuation shifts had a bigger impact on the US NIIP.
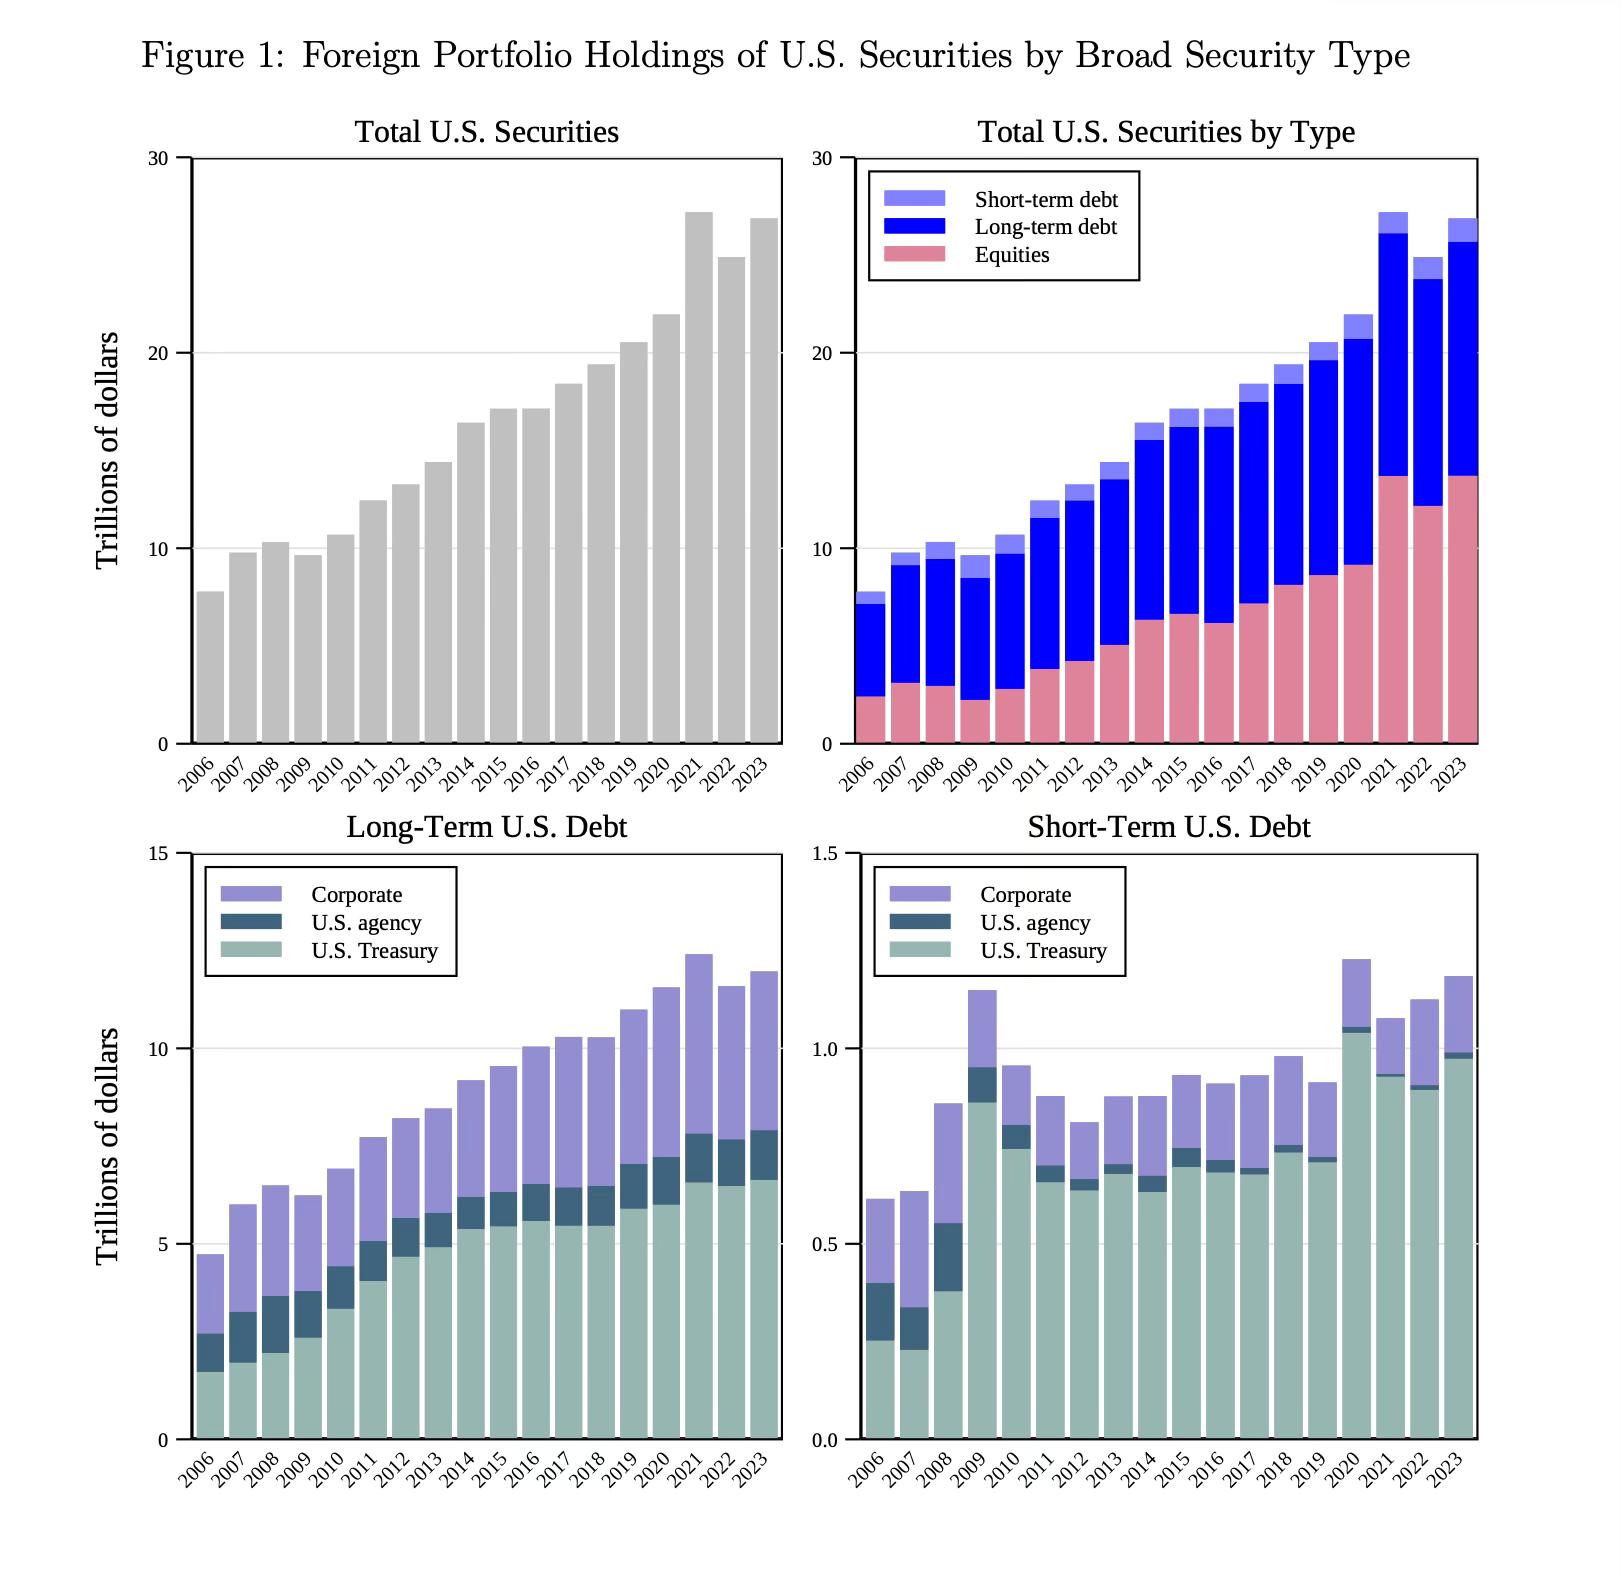
Before I continue with some important paper excerpts, I want to post recent Treasury data on foreign ownership of US assets so that the reader can visualize the recent evolution. Note that the shift into equities by foreigners was well-timed.
Perri: By the mid 2000s, gross cross-border equity positions were larger, and because equity markets in the ROW outperformed the U.S. during this period, the U.S. NFA position improved.
In the post GFC period, gross equity positions were larger still. A dramatic rise in U.S. equity prices over this period applied to very large gross equity liabilities led to a sharp increase in the value of U.S. equity liabilities. In particular, the dollar price of U.S. equity liabilities peaked in 2021 at over 4.5 times the price at the end of 2008, while the price of U.S. foreign equity assets rose by only a factor of two. Thus, the value of U.S. foreign equity assets rose by much more than the value of equity liabilities, translating into an unprecedented decline in the U.S. NFA position.
To summarize, differential equity price growth matters more for the NFA position when gross international equity positions are large. U.S. equity markets outperformed in the post 2010 period, precisely when it mattered most for the NFA position.
We document that this unprecedented decline in the U.S. NFA position has been driven by a boom in the market valuation of the non-financial assets in U.S. corporations. Because foreigners’ gross holdings of equity in U.S. corporations have grown to be very large, this boom has mechanically increased the market value of U.S. liabilities to the rest of the world (henceforth, ROW).
An equity crash would improve the NIIP. It’s theoretically possible that recent strong US equity returns were a temporary blip that could reverse before foreigners make portfolio adjustments.
Perri et al: We find that much of the increase in the market valuation of the non-financial assets in U.S. corporations over the past decade has been due a dramatic increase in the free cash flow from operations available to pay to owners of firms.
The authors’ reason for examining whether strong US equity performance is driven by a real factors is twofold:
Although it is unknowable whether recent strong US stock market performance is fundamentals-driven or a blip, it does matter for the NIIP discussion. If it’s fundamentals-driven, then the consequences that US equity performance has had on the NIIP evolution are more likely to be long-lasting. Preview: The authors find that strong US Equity performance, when looked at from the broad lens of 2010-2023 (time of publication), has largely been fundamentals-driven. Specifically, free cash flows available to owners has increased significantly, largely because the share of GDP represented by US corporate profits has increased.
There are welfare implications if there is increased foreign ownership of stocks at a time when free cash flow available to owners has increased. If the share of US GDP represented by corp profits increases from 9% to 13%, and US citizens own all the shares, the welfare implications are somewhat ambiguous because labor loses but corporate owners gain. If foreigners own the equity, the welfare implications are unambiguously negative bc labor loses and many of the profits flow overseas.
Perri et al: We define this free cash flow to owners of firms as the amount left over from corporate sector value added after deducting payments to labor, taxes (both indirect business taxes and taxes on corporate profits), and investment expenditures on new non-financial assets. As such, free cash flow can be measured from the National Income and Product Accounts (NIPA) with minimal model assumptions. This increase in the free cash flow from U.S. corporations relative to corporate gross value added (henceforth, GVA) is unprecedented in post-WWII data. We find that changes in the valuation multiple applied to those cash flows have played a much smaller role in driving the increased valuation of U.S. corporations. In our accounting, some of this increase in corporate free cash flow is due to changes in taxes and the share of labor in costs, but the lion’s share is due to an increase in the wedge between revenue and total cost, resulting in a large increase in the share of factorless income in U.S. corporate GVA. In what follows, we refer to this wedge as the output wedge.3
Second, when we use our model to simulate counterfactuals, we find that the welfare implications of these developments driving the increase in valuation of U.S. corporations are dramatically impacted by the observed large increase in gross cross-border equity positions. Specifically, we find that had U.S. residents been the sole owners of U.S. corporations, the observed rise in the output wedge would have had only a small impact on the welfare of a representative U.S. household. This welfare impact would have been small because lower wage income would have been largely offset by higher free cash flow to U.S. households as owners of U.S. corporations.4 In contrast, given the large cross-border equity positions observed in the data, we find that the observed rise in the output wedge has a large negative impact on the consumption of U.S. residents. The reason is simple: much of the increase in free cash flow of U.S. firms is paid to foreign owners.
Ok, that’s in the end of the excerpts. Sorry, but this is an important paper.
Let’s back up and take a 30k foot view.
When you run a trade deficit, you have to pay for it in the form of giving an IOU or by giving equity. You would always prefer to give an IOU.
For a long time, our desire to give IOUs rather than equity in payment for our trade deficit was aided by the fact that the majority of our trade deficit was with China. In China, the vast majority of corporate profits are turned over to the government, and for many years the government was happy to invest these profits in US govmt securities and US agency debt.
An important side story, perhaps for another day, is increased foreign ownership of US equities is the massive increase in the past two decades of foreign passive ownership in private equity and venture capital firms.
Our Middle Eastern trading partners prefer equity when they can get it. A Dubai World deal to buy six American ports was blocked by Congress in 2006 but a 2007 deal to invest $5 billion in MGM’s City Center went through. Overpayment has proved a valuable tactic to overcome political obstacles, as in the recent LIV Tour expansion. The move by the NFL, which will allow private equity firms to buy stakes in NFL teams, can be viewed similarly; foreigners will invest in PE firms that will then overpay for NFL ownership pieces.